About this report
The Regional Tourism Satellite Accounts (RTSA) present annual data for Australia’s tourism regions. The results in the RTSA are consistent with the State Tourism Satellite Accounts and the National Tourism Satellite Accounts.
The data in this report includes:
- tourism gross value added (GVA) – direct, indirect, and total
- tourism gross regional product (GRP) – direct, indirect, and total
- tourism filled jobs by full-time or part-time
- tourism consumption by visitor type (international or domestic).
This data allows for comparison between:
- individual regions
- the tourism industry and other industries in the economy.
Explore summary data
You can explore summary data by:
- choosing a state and a tourism region using the drop-down menus
- choosing to view direct, indirect or total figures in the data tables
- viewing the data for 2023–24 and the change from 2022–23 in the table
- hovering over the chart elements to show the total result.
A note on sample size: results for smaller regions that are based on sample sizes of less than 500 are less reliable and should be used with caution.
See Notes on the data for more information and a sample size table for the regions.
Key findings
The visitor economy experienced continued growth in 2023-24, with Australia’s direct tourism GDP growing in nominal terms from $71.6 billion in 2022-23 to $78.1 billion in 2023-24, a 9.1% increase on 2022-23. Direct tourism filled jobs grew by 5.7% in 2023-24 compared with 2022-23, to reach 691,500.
During 2023-24, 76% (58 out of 76) of all tourism regions experienced growth in direct tourism GVA while growth in direct tourism filled jobs occurred across 63% (or 48 of 76) of all tourism regions across Australia.
GVA growth in nominal terms in 2023-24 compared with 2022-23 across the regions was generally strong:
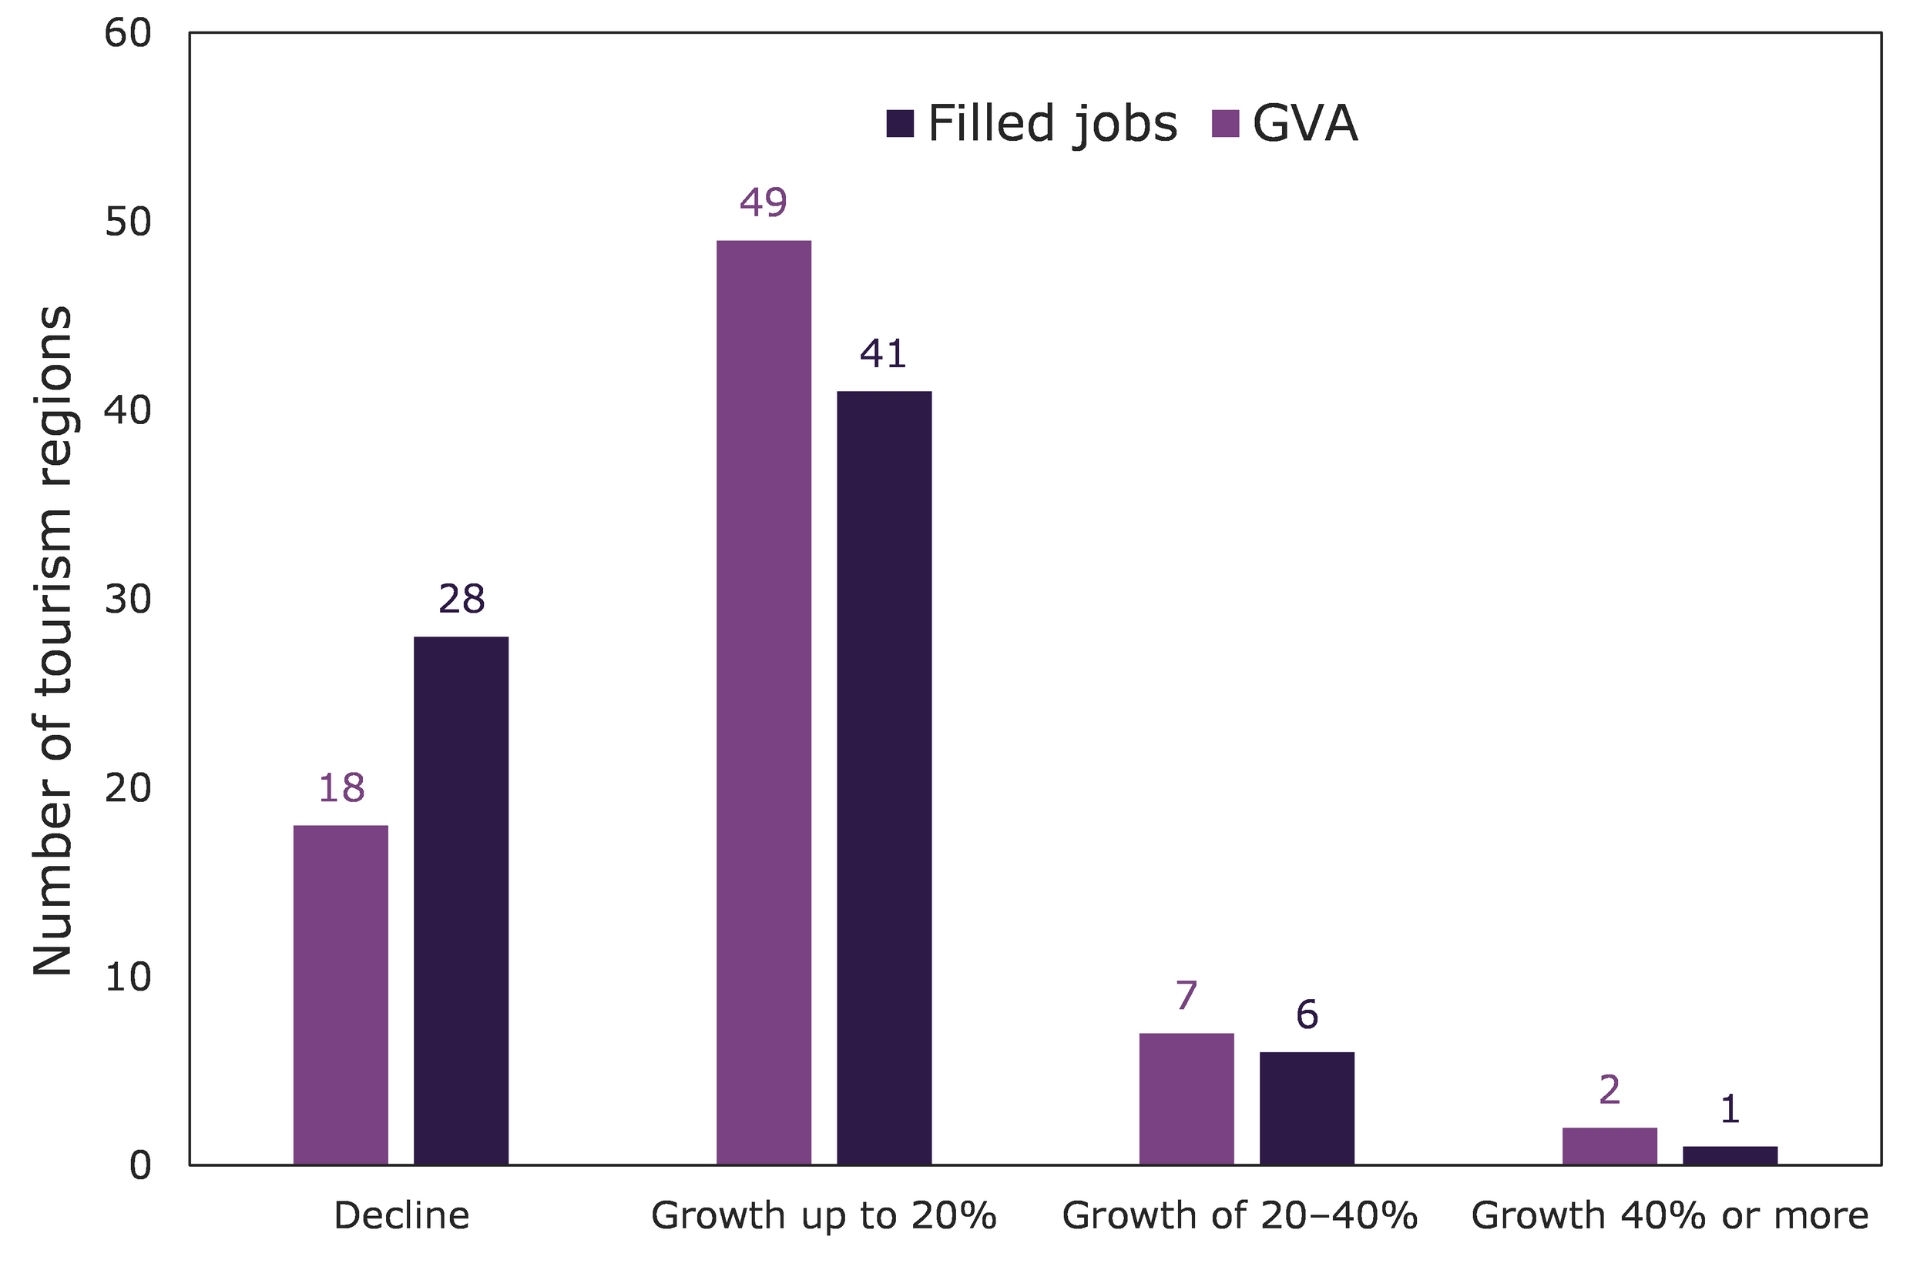
- two tourism regions achieved a GVA growth of 40% or more
- GVA growth between 20% and 40% occurred in 7 tourism regions (or 9% of tourism regions)
- most tourism regions (64% or 49 tourism regions) achieved growth of up to 20%
- nearly a quarter (24%) of tourism regions (18 tourism regions) experienced a decline in GVA.
In terms of direct tourism filled jobs, growth in 2023-24 when compared with 2022-23 was typically less than for GVA across the regions, with:
- growth in filled jobs of more than 40% in one tourism region
- filled jobs growth of between 20% and 40% in 6 tourism regions (or 8% of tourism regions)
- filled jobs growth of up to 20% in 41 tourism regions (or 54% of tourism regions)
- a decline in filled jobs occurred in 28 (37%) tourism regions.
Figure 1. Number of tourism regions by rate of growth in direct tourism GVA and filled jobs, 2023-24 compared with 2022-23.

The tourism share of total regional GVA and regional filled jobs was greater for regional areas than for capital cities. In 2023-24:
- the tourism share of nominal GVA was 3.6% in regional areas, compared with 2.2% in capital cities including the Gold Coast
- the tourism share of GVA was higher in regional areas than in the capital city for all states and territories except Tasmania. For Tasmania the GVA share was higher for the Hobart tourism region when compared with regional areas.
- tourism’s share of direct tourism filled jobs was 7.1% in regional areas, compared with 3.2% in the capital cities
- tourism’s share of filled jobs was higher in regional areas than capital cities for all states and territories. This difference was most pronounced in Western Australia, Northern Territory, Victoria, South Australia and New South Wales (Table 1).
Table 1. Direct tourism GVA and tourism filled jobs shares of capital city and regional areas in 2023-24 by state/territory.
| State and territory | Direct tourism share in 2023-24 | |||
| Capital city tourism regions including Gold Coast | Regional Areas | |||
| GVA | Filled jobs | GVA | Filled jobs | |
| New South Wales | 2.2% | 2.7% | 3.7% | 6.1% |
| Victoria | 2.3% | 3.0% | 4.0% | 7.9% |
| Queensland | 3.0% | 3.8% | 3.8% | 6.9% |
| South Australia | 2.5% | 3.0% | 3.5% | 7.0% |
| Western Australia | 1.2% | 3.0% | 2.3% | 9.9% |
| Tasmania | 4.9% | 6.6% | 4.6% | 7.5% |
| Northern Territory | 3.0% | 3.7% | 5.5% | 8.2% |
| Australian Capital Territory | 2.5% | 4.2% | - | - |
| Australia | 2.2% | 3.2% | 3.6% | 7.1% |
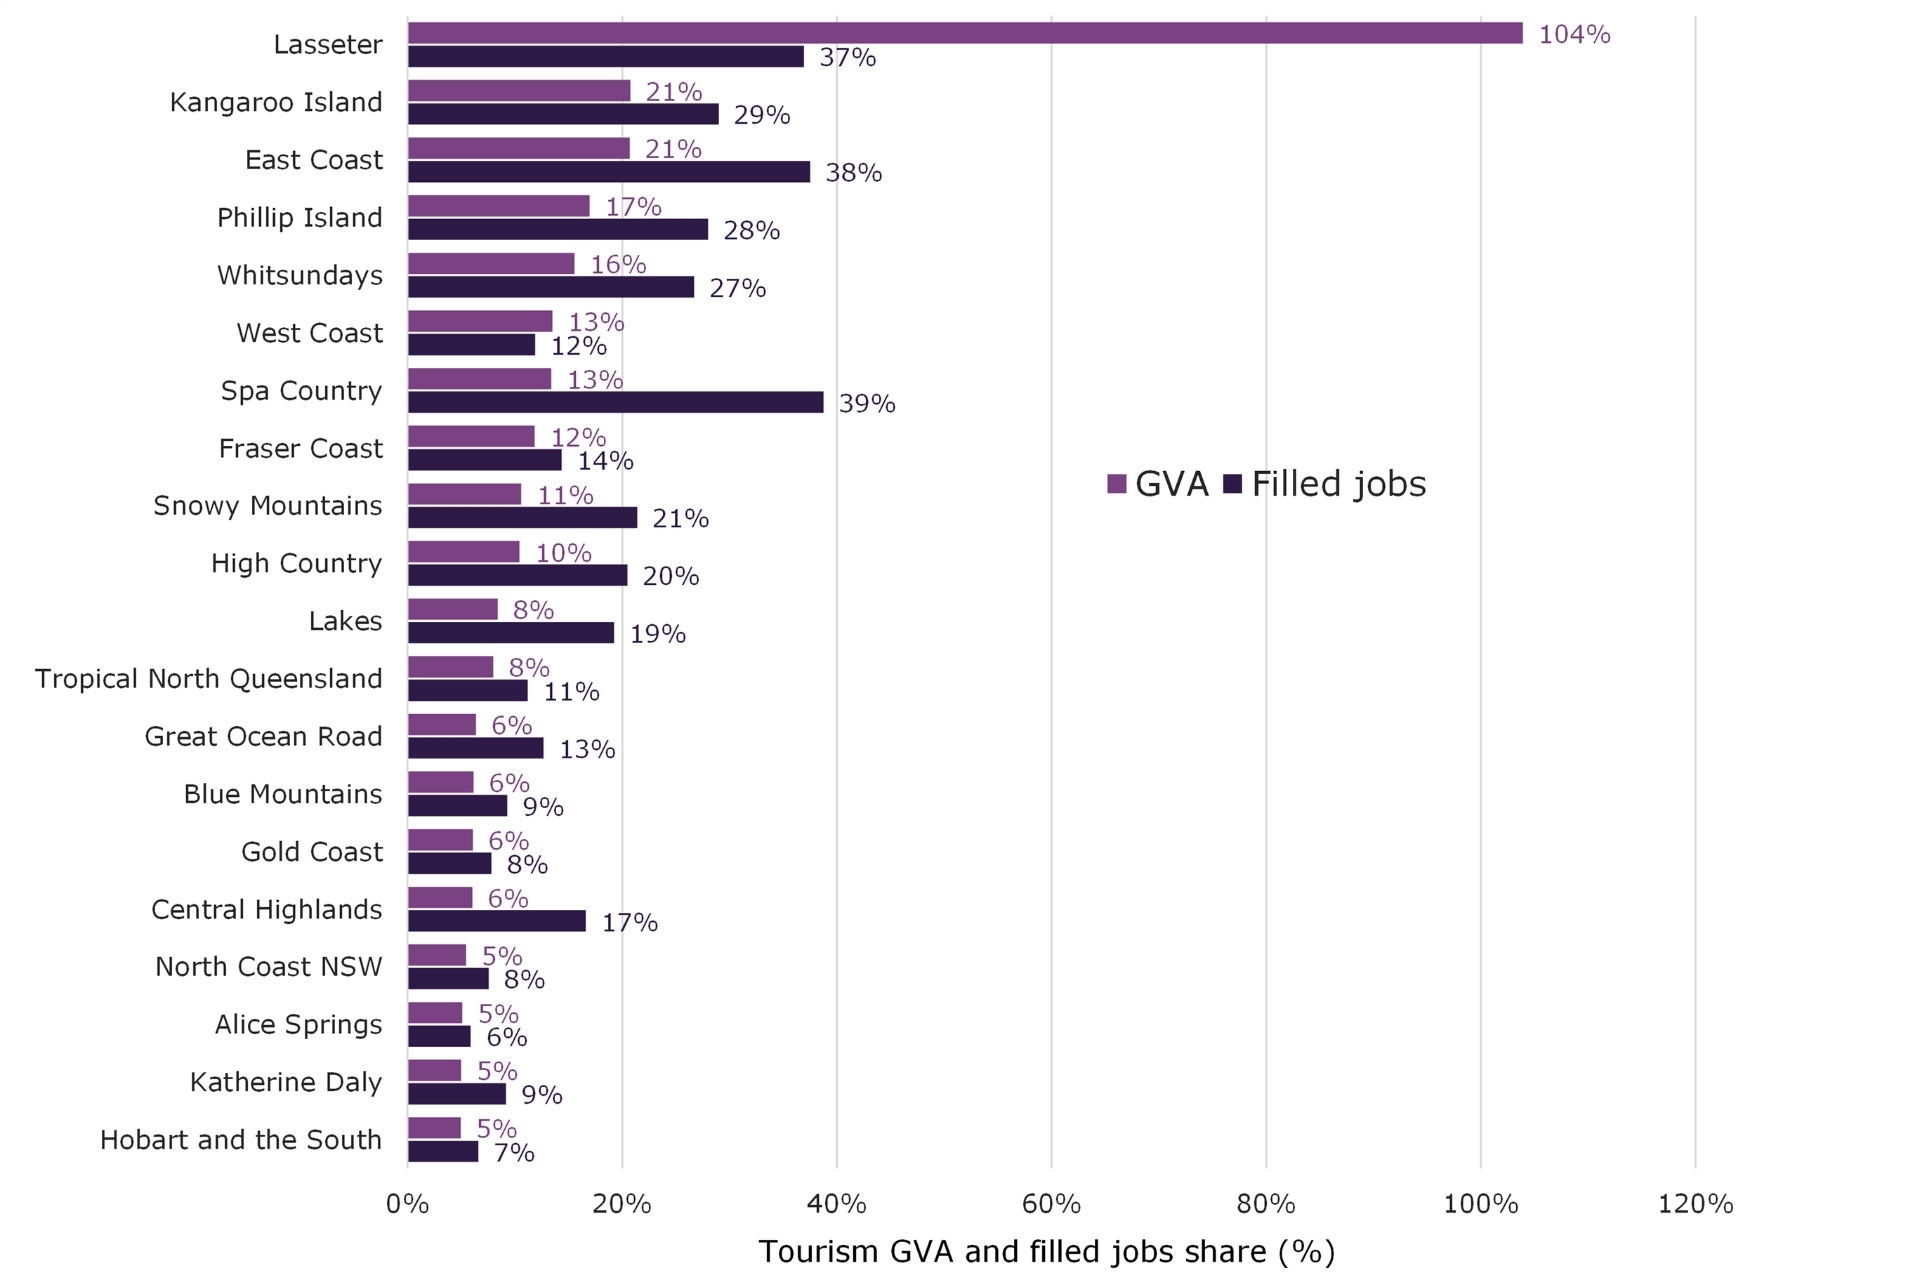
The RTSA data also highlights the importance of tourism to each of Australia’s 76 tourism regions. Figure 2 shows the 20 tourism regions where tourism contributed the highest shares of total GVA and filled jobs in 2023-24. These included:
- Lasseter (Northern Territory) – where tourism revenue accounted for 104%[1] of the region’s total GVA and 37% of all jobs
- Kangaroo Island (South Australia) – where tourism revenue accounted for 21% of the region’s total GVA and 29% of all jobs
- East Coast (Tasmania) – where tourism revenue accounted for 21% of the region’s total GVA and 38% of all jobs
- Phillip Island (Victoria) – where tourism revenue accounted for 17% of the region’s total GVA and 28% of all jobs
- Spa Country (Victoria) – where tourism revenue accounted for 13% of the region’s total GVA and 39% of all jobs
- Whitsundays (Queensland) – where tourism revenue accounted for 16% of the region’s total GVA and 27% of all jobs.
[1] It is often the case for Lasseter that tourism’s share of regional GVA is over 100%. This is because the region produces a lot of tourism outputs that are consumed in other regions, so the region’s tourism production is higher than all the consumption in that region.
Figure 2. Tourism share of regional GVA and filled jobs in 2023-24 by tourism region.

Note: Results for tourism regions with a sample size < 500 are less reliable and should be used with caution.
State and territory data tables
You can explore state and territory data by choosing a state or territory from the tabs and select a tourism region.
You can view:
- regional summary – a time series of the data from 2016–17 to 2023–24
- consumption by tourism product
- gross value added – the economic value of goods and services produced
- tourism filled jobs by industry
- state summary – direct, indirect, and total results.
Industries in tourism are grouped in 2 categories:
- tourism characteristic industry – industries in this group must have at least 25% of their output consumed by visitors
- tourism connected industry – industries in this group must have a tourism-related product identifiable and appropriate for visitor consumption.
Download regional data tables
Caution should be used when interpreting regional data results that are based on small sample sizes. For details, see Notes on the data.
- Blue Mountains (XLSX 104KB)
- Capital Country (XLSX 104KB)
- Central Coast (XLSX 104KB)
- Central NSW (XLSX 104KB)
- Hunter (XLSX 104KB)
- New England North West (XLSX 104KB)
- North Coast NSW (XLSX 104KB)
- Outback NSW (XLSX 104KB)
- Riverina (XLSX 104KB)
- Snowy Mountains (XLSX 104KB)
- South Coast (XLSX 104KB)
- Sydney (XLSX 104KB)
- The Murray (XLSX 104KB)
- Brisbane (XLSX 104KB)
- Bundaberg (XLSX 104KB)
- Capricorn (XLSX 104KB)
- Fraser Coast (XLSX 104KB)
- Gladstone (XLSX 104KB)
- Gold Coast (XLSX 104KB)
- Mackay (XLSX 104KB)
- Outback Queensland (XLSX 104KB)
- Queensland Country (XLSX 104KB)
- Sunshine Coast (XLSX 104KB)
- Townsville (XLSX 104KB)
- Tropical North Queensland (XLSX 104KB)
- Whitsundays (XLSX 104KB)
- Adelaide (XLSX 104KB)
- Adelaide Hills (XLSX 104KB)
- Barossa (XLSX 104KB)
- Clare Valley (XLSX 104KB)
- Eyre Peninsula (XLSX 104KB)
- Fleurieu Peninsula (XLSX 104KB)
- Flinders Ranges and Outback (XLSX 104KB)
- Kangaroo Island (XLSX 104KB)
- Limestone Coast (XLSX 104KB)
- Murray River, Lakes and Coorong (XLSX 104KB)
- Riverland (XLSX 104KB)
- Yorke Peninsula (XLSX 104KB)
- Ballarat (XLSX 105KB)
- Bendigo Loddon (XLSX 106KB)
- Central Highlands (XLSX 106KB)
- Central Murray (XLSX 106KB)
- Geelong and Bellarine (XLSX 106KB)
- Gippsland (XLSX 106KB)
- Goulburn (XLSX 106KB)
- Great Ocean Road (XLSX 106KB)
- High Country (XLSX 106KB)
- Lakes (XLSX 106KB)
- Macedon (XLSX 106KB)
- Mallee (XLSX 106KB)
- Melbourne (XLSX 106KB)
- Murray East (XLSX 106KB)
- Peninsula (XLSX 106KB)
- Phillip Island (XLSX 106KB)
- Spa Country (XLSX 106KB)
- Western Grampians (XLSX 106KB)
- Wimmera (XLSX 106KB)
- Yarra Valley and Dandenong Ranges (XLSX 106KB)
Notes on the data
Results for smaller tourism regions with a visitor sample at or below 500 are less reliable than higher sample results. For this reason, estimates of GVA, GRP and filled jobs for smaller regions are traditionally ‘smoothed’ by taking an average over 3 years.
However, due to the smaller series and an absence of a three-year normal cycle we are not providing any smoothed results.
The RTSA model is complex. A region’s results may not always reflect raw spend data if sample size is small. The model starts by looking at visitor nights by purpose of visit to a region. Then it groups categories until the sample size is big enough to be reliable. Because of these data adjustments, results may not always align with visitor surveys results. This can happen if visitor types change or sample size is too small to reflect nuance.
Sample sizes by region are displayed in the Sample size table 2023-24 (XLSX 86KB) document.
Revisions to time series data
In line with National and State Tourism Satellite Accounts, revisions have been applied to RTSA estimates from 2016–17 to 2022–23. For further details on the revision and changes in methodology please refer to Changes in NTSA. There are two data sources that typically contribute to revisions:
- Australian Bureau of Statistics (ABS) National Accounts data. Revisions occur yearly and directly affect GVA for each region, as well as filled jobs.
- Tourism Research Australia’s regional expenditure data, which affects tourism’s economic value and share of regional economies.
