State and Regional Tourism Satellite Accounts 2024–25
For the 2024–25 release, a new sub–national tourism satellite account model has replaced the former State Tourism Satellite Account and Regional Tourism Satellite Account models. As such, comparisons between the new sub–national outputs and previously published results should be used with caution. A back–cast of all results at a state and territory level back to 2018–19 and at a tourism region level for 2023–24 has been produced to allow trend comparisons. Further details about key changes are provided at the end in section entitled, "Changes in this issue".
Tourism Satellite Accounts – the economic value of tourism
The State and Regional Tourism Satellite Accounts provide annual estimates of tourism's economic contribution across all Australian states and territories and 76 tourism regions. The combination of national coverage, regional granularity and annual publication places Australia among the world’s leading jurisdictions in the production of sub-national tourism satellite account statistics. The economic value of tourism to Australia’s economy is estimated using an internationally accepted framework – a tourism satellite account. This produces measures for tourism against gross domestic product, gross value added, trade, and employment.
The Australian Bureau of Statistics produces the estimates at a national level (with input from the International Visitor Survey and the Domestic Tourism Statistics). Tourism Research Australia (TRA) produces the state and regional estimates, available on this page.
The data tables presented in this publication are useful in understanding:
- tourism’s contribution to and share of the state or regional Gross Product (GSP or GRP), jobs and exports
- the value of tourism goods and services consumed by visitors in a state or territory and a tourism region.
The 2024–25 results are compared with 2023–24 results in this publication. A time series for States and Territories (2018–19 to 2024–25) and two years (2023–24 and 2024–25) of results for tourism regions are available for download in the data tables section.
The State and Regional Tourism Satellite Accounts complement the work of the National Tourism Satellite Account by examining tourism performance at a state, territory and tourism region level, as well as providing estimates for the indirect economic and jobs impacts of tourism. For more information on tourism satellite account terminology and how we apply the data, please see the explanatory notes.
Explore the data and regional dashboards
You can explore the data by:
- choosing a state or territory in the state dashboard, or choosing a tourism region in the tourism region dashboard, using the drop–down menu
- choosing to view direct, indirect or total effects of tourism in the key economic aggregates tables
- viewing the data for 2024–25 and the change from 2023–24 in the tables
- hovering over the chart elements to show the total results.
State Tourism Satellite Account
Regional Tourism Satellite Account
Key findings
During 2024–25 the visitor economy continued to experience growth supported by an increase in domestic travel and continued recovery of international visitor numbers. Australia’s total tourism consumption, tourism GDP, tourism filled jobs, tourism exports and tourism imports all increased in 2024–25 and reached record high levels. However, results vary significantly by state, territory and tourism region, as outlined below.
Tourism consumption
Tourism consumption was $211.1 billion in 2024–25. Tourism consumption was up 3.4% (or $7.0 billion) on the previous year. While tourism consumption increased nationally, this measure varied for states and territories in 2024–25, with the Northern Territory seeing the strongest year-on-year growth (Table 1). In order of the strongest growth rate among the states and territories:
- Northern Territory was up 12.8% (or $0.3 billion)
- Victoria was up 5.8% or ($2.8 billion)
- New South Wales was up 5.1% (or $3.2 billion)
- Queensland was up 3.9% (or $1.9 billion)
- South Australia was up 2.0% (or $0.2 billion)
- Tasmania was up 0.8% (or $0.04 billion)
- Australian Capital Territory was down 0.3% (or $0.01 billion), and
- Western Australia was down 6.3% (or $1.4 billion).
| State | Consumption 2024-25 | Change from 2023-24 | |
|---|---|---|---|
| $ billion | $ billion | Per cent | |
| New South Wales | 65.9 | 3.2 | 5.1% |
| Victoria | 51.4 | 2.8 | 5.8% |
| Queensland | 49.0 | 1.9 | 3.9% |
| South Australia | 12.0 | 0.2 | 2.0% |
| Western Australia | 21.1 | -1.4 | -6.3% |
| Tasmania | 5.4 | 0.0 | 0.8% |
| Northern Territory | 2.6 | 0.3 | 12.8% |
| Australian Capital Territory | 3.7 | 0.0 | -0.3% |
| Total | 211.1 | 7.0 | 3.4% |
Tourism consumption in most capital city tourism regions increased in 2024–25 when compared with 2023–24 except for Western Australia and the Australian Capital Territory. In Western Australia both capital city and non-capital tourism regions experienced a decline in tourism consumption, with a stronger decline in regional tourism areas.
Among other states and territories, the overall pattern of growth showed differences across regional-based and city-based tourism regions:
- Regional areas in the Northern Territory reported a growth of 14.3% in comparison to 11.6% growth in the Darwin tourism region
- In Queensland, regional areas increased by 4.8%, whereas Brisbane and Gold Coast together increased by 3.3%
- Tasmanian regional areas declined by 1.1%, whereas Hobart and the South grew by 2.7% and
- Tourism consumption in Canberra declined by 0.3%.
| Consumption ($m) | Change on 2023-24 | |||
|---|---|---|---|---|
| State and Territory | Capital cities | Regional areas | Capital cities | Regional areas |
| New South Wales | 36,360.9 | 29,563.5 | 6.6% | 3.4% |
| Victoria | 33,445.0 | 17,957.9 | 7.0% | 3.7% |
| Queenland | 29,137.3 | 19,864.3 | 3.3% | 4.8% |
| South Australia | 7,424.2 | 4,577.0 | 2.6% | 0.9% |
| Western Australia | 14,710.1 | 6,375.1 | -4.6% | -10.1% |
| Tasmania | 2,712.9 | 2,689.0 | 2.7% | -1.1% |
| Northern Territory | 1,421.9 | 1,199.8 | 11.6% | 14.3% |
| Australian Capital Territory | 3,701.2 | - | -0.3% | - |
Gross State Product from tourism
Tourism’s direct share of the national economy was 2.9% in 2024–25. Direct tourism Gross State Product (GSP) for all states and territories was $81.1 billion in 2024–25. This was up 3.8% on 2023–24. By comparison, Gross Domestic Product (GDP) for the whole Australian economy in 2024–25 grew 3.7% on 2023–24.
Direct tourism GSP increased for all states and territories in 2024–25 compared with 2023–24 levels (Table 2) except for Western Australia, which experienced a decline (down 5.3%) and the Australian Capital Territory, which remained unchanged. In other states and territories, this growth varied across jurisdictions:
- Northern Territory – up 12.5% (or $0.1 billion)
- Victoria – up 6.3% (or $1.2 billion)
- New South Wales – up 5.8% (or $1.4 billion)
- Queensland – up 3.5% (or $0.6 billion)
- South Australia – up 2.2% (or $0.1 billion), and
- Tasmania – up 1.0% (or $0.02 billion).
| State | Direct tourism GSP 2024-25 | Change from 2023-24 | |
|---|---|---|---|
| $ billion | $ billion | Per cent | |
| New South Wales | 25.3 | 1.4 | 5.81% |
| Victoria | 19.6 | 1.2 | 6.3% |
| Queenland | 19.2 | 0.6 | 3.5% |
| South Australia | 4.5 | 0.1 | 2.2% |
| Western Australia | 8.0 | -0.4 | -5.3% |
| Tasmania | 2.1 | 0.0 | 1.0% |
| Northern Territory | 1.1 | 0.1 | 12.5% |
| Australian Capital Territory | 1.5 | 0.0 | 0.0% |
| Total | 81.1 | 3.0 | 3.8% |
Indirect tourism GSP for all states and territories was $79.0 billion in 2024–25. As a result, total GSP (direct plus indirect) was $160.1 billion in 2024–25. This indirect GSP contribution represented a 2.8% share of national GDP in 2024–25. This compares with a 2.9% share in 2023–24 and a 3.0% share in 2018–19.
In measuring indirect GSP impacts, the increase on 2023–24 varied between an 8.1% increase for the Northern Territory and a 0.1% decline for Australian Capital Territory. All states and territories surpassed pre–pandemic levels (Table 4).
| State | Indirect tourism GSP 2024-25 | Change from 2023-24 | |
|---|---|---|---|
| $ billion | $ billion | Per cent | |
| New South Wales | 26.3 | 1.2 | 4.9% |
| Victoria | 20.4 | 0.6 | 3.2% |
| Queensland | 16.3 | 0.6 | 3.6% |
| South Australia | 4.2 | 0.0 | 0.9% |
| Western Australia | 8.6 | 0.0 | 0.0% |
| Tasmania | 1.4 | 0.0 | 0.5% |
| Northern Territory | 0.5 | 0.0 | 8.1% |
| Australian Capital Territory | 1.2 | 0.0 | -0.1% |
| Total | 79.0 | 2.5 | 3.3% |
At the regional level (see Figure 1), in 2024–25 when compared with 2023–24, nearly two thirds (64% or 49 tourism regions) of all 76 tourism regions in Australia experienced a direct GRP (gross regional product) growth of up to 10%, and 11 tourism regions (or 14%) reported a direct GRP growth of more than 10%*. There were 16 tourism regions, comprising 21% of total tourism regions, where direct and total GRP declined in 2024–25 when compared with the previous year. Following are the jurisdictions showing the concentration of tourism regions where direct tourism GRP declined in 2024–25 when compared to 2023–24:
- Western Australia (5 tourism regions)
- South Australia (4 tourism regions)
- Victoria (3 tourism regions)
- Tasmania (2 tourism regions)
- New South Wales (one tourism region each), and
- the Australian Capital Territory.
*Please note that regional TSA results for some of the smaller/sparse tourism regions may be affected by smaller sample size. The tourism regions which do not satisfy sample size conditions are presented in an Appendix at the end of this publication.
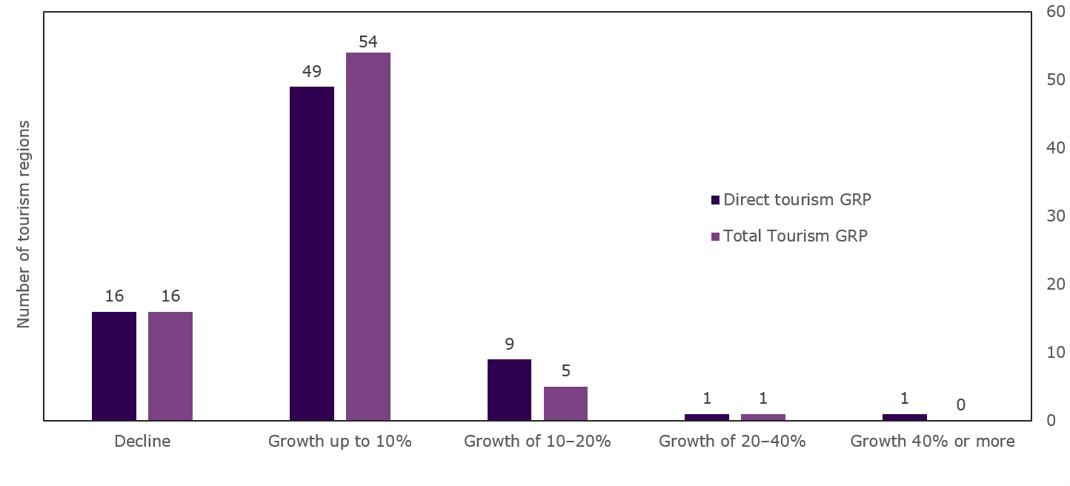
Figure 1. Direct and total tourism GRP growth in 2024–25 across tourism regions in Australia
Tourism filled jobs
Since 2021–22, ABS has adopted ‘tourism filled jobs’ as the standard metric for reporting tourism employment. Therefore, the 2024–25 Sub-national State and Regional Tourism Satellite Account also use this metric (see explanatory notes for further information).
At the end of 2024–25, there were 695,900 direct tourism filled jobs in Australia, up 2.1% on the previous year, with similar growth in Australian jobs over the same period (also 2.1%). As a result, tourism’s share of total filled jobs remained at 4.4% in 2024–25.
In addition to direct jobs, tourism generated a further 469,500 indirect jobs in the economy making a combined contribution of 1,165,400 direct and indirect jobs to the visitor economy. As a share of the economy, tourism’s indirect jobs contribution increased from a 2.9% share in 2023–24 to 3.0% in 2024–25.
Compared with 2023–24 levels, five states and territories had higher direct and total tourism filled jobs in 2024–25 and three states and territories had lower direct and total tourism filled jobs:
- Northern Territory registered the highest growth in direct (up 9.2%) and total jobs (up 8.2%)
- In Queensland direct filled jobs (up 4.6%) and total filled jobs (up 3.2%) increased.
- In New South Wales total filled jobs (up 4.1%) and direct filled jobs (up 3.9%) increased.
- In Victoria total filled jobs (up 3.5%) and direct filled jobs (up 2.4%) increased.
- In South Australia, total filled jobs (up 2.4%) and direct filled jobs (up 1.4%) increased.
- In Tasmania, total filled jobs (down 0.2%) and direct filled jobs (down 1.4%) declined.
- In the Australian Capital Territory total filled jobs (down 3.0%) and direct filled jobs (down 7.9%) declined.
- In Western Australia total filled jobs (down 3.9%) and direct filled jobs (down 7.2%) declined.
| State | Tourism Jobs 2024-25 (000) | Change from 2023-24 (%) | ||
|---|---|---|---|---|
| Direct jobs | Total jobs* | Direct jobs | Total jobs* | |
| New South Wales | 203.2 | 346.8 | 3.9% | 4.1% |
| Victoria | 189.6 | 322.1 | 2.4% | 3.5% |
| Queensland | 161.0 | 260.8 | 4.6% | 3.2% |
| South Australia | 39.2 | 69.8 | 1.4% | 2.4% |
| Western Australia | 65.2 | 106.8 | -7.2% | -3.9% |
| Tasmania | 20.9 | 32.0 | -1.4% | -0.2% |
| Northern Territory | 6.4 | 9.5 | 9.2% | 8.2% |
| Australian Capital Territory | 10.5 | 17.6 | -7.9% | -3.0% |
| Total | 695.9 | 1,165.4 | 2.1% | 2.6% |
*Denotes direct and indirect tourism jobs
At the tourism region level 70% (53 tourism regions) of all tourism regions in Australia registered growth in direct tourism filled jobs*. A majority (41 tourism regions) had growth of up to 10% in 2024–25 when compared with the previous year. This becomes 50 tourism regions when indirect tourism filled jobs are added. Similar to changes in GRP across the tourism regions, there were some jurisdictions which reported a decline in direct tourism filled jobs in 2024–25 compared to the previous year. These were:
- Western Australia (5 tourism regions)
- Victoria (5 tourism regions)
- Tasmania (4 tourism regions)
- New South Wales (4 tourism regions)
- South Australia (3 tourism regions)
- Queensland (one tourism region), and
- The Australian Capital Territory.
* Please note that regional TSA results for some of the smaller/sparse tourism regions may be affected by smaller sample size. The tourism regions which do not satisfy sample size conditions are presented in an Appendix at the end of this publication.
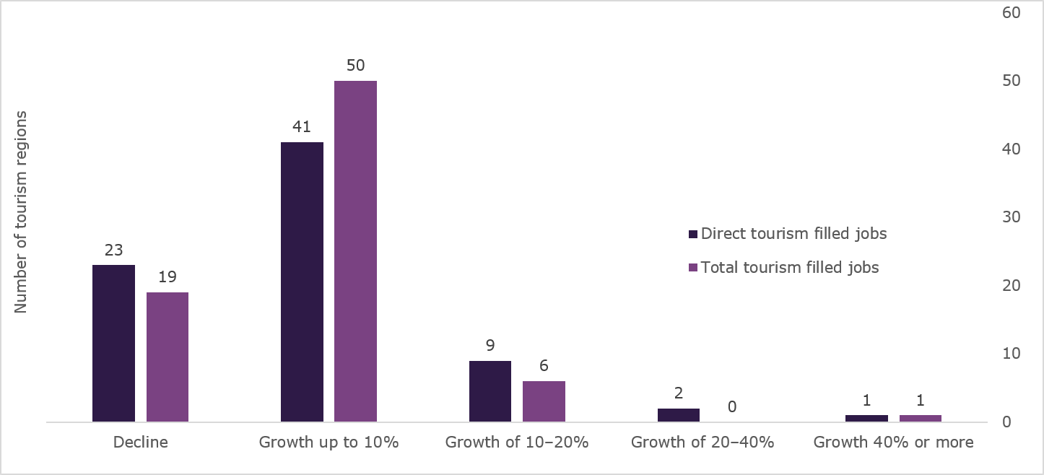
Figure 2. Annual growth of direct and total tourism filled jobs in 2024–25 across tourism regions in Australia
Data tables
Find out more about tourism consumption, jobs, and economic activity in our data tables.
- Blue Mountains (XLSX 104KB)
- Capital Country (XLSX 104KB)
- Central Coast (XLSX 104KB)
- Central NSW (XLSX 104KB)
- Hunter (XLSX 104KB)
- New England North West (XLSX 104KB)
- North Coast NSW (XLSX 104KB)
- Outback NSW (XLSX 104KB)
- Riverina (XLSX 104KB)
- Snowy Mountains (XLSX 104KB)
- South Coast (XLSX 104KB)
- Sydney (XLSX 104KB)
- The Murray (XLSX 104KB)
- Brisbane (XLSX 104KB)
- Bundaberg (XLSX 104KB)
- Capricorn (XLSX 104KB)
- Fraser Coast (XLSX 104KB)
- Gladstone (XLSX 104KB)
- Gold Coast (XLSX 104KB)
- Mackay Isaac (XLSX 104KB)
- Outback Queensland (XLSX 104KB)
- Queensland Country (XLSX 104KB)
- Sunshine Coast (XLSX 104KB)
- Townsville (XLSX 104KB)
- Tropical North Queensland (XLSX 104KB)
- Whitsundays (XLSX 104KB)
- Adelaide (XLSX 104KB)
- Adelaide Hills (XLSX 104KB)
- Barossa (XLSX 104KB)
- Clare Valley (XLSX 104KB)
- Eyre Peninsula (XLSX 104KB)
- Fleurieu Peninsula (XLSX 104KB)
- Flinders Ranges and Outback (XLSX 104KB)
- Kangaroo Island (XLSX 104KB)
- Limestone Coast (XLSX 104KB)
- Murray River, Lakes and Coorong (XLSX 104KB)
- Riverland (XLSX 104KB)
- Yorke Peninsula (XLSX 104KB)
- Ballarat (XLSX 105KB)
- Bendigo Loddon (XLSX 106KB)
- Central Highlands (XLSX 106KB)
- Central Murray (XLSX 106KB)
- Geelong and Bellarine (XLSX 106KB)
- Gippsland (XLSX 106KB)
- Goulburn (XLSX 106KB)
- Great Ocean Road (XLSX 106KB)
- High Country (XLSX 106KB)
- Lakes (XLSX 106KB)
- Macedon (XLSX 106KB)
- Mallee (XLSX 106KB)
- Melbourne (XLSX 106KB)
- Murray East (XLSX 106KB)
- Peninsula (XLSX 106KB)
- Phillip Island (XLSX 106KB)
- Spa Country (XLSX 106KB)
- Western Grampians (XLSX 106KB)
- Wimmera (XLSX 106KB)
- Yarra Valley and Dandenong Ranges (XLSX 106KB)
Explanatory notes: changes in this issue
The 2024–25 State and Regional Tourism Satellite Accounts introduce a substantially redeveloped sub-national tourism modelling framework. The update aligns with changes to the Australian Bureau of Statistics' (ABS) National Tourism Satellite Account (NTSA) and Tourism Satellite Account (TSA) methodology, as well as Tourism Research Australia's (TRA's) transition from the National Visitor Survey (NVS) to the Domestic Tourism Statistics (DoTS) collection to measure domestic tourism.
Due to the introduction of DoTS, revisions to the NTSA, updated employment ratios, and the redevelopment of the sub-national model, results in this publication are not directly comparable with previously published State Tourism Satellite Account (STSA) and Regional Tourism Satellite Account (RTSA) estimates. Users should take care when comparing results with earlier publications.
The transition from the National Visitor Survey (NVS) to Domestic Tourism Statistics (DoTS) required the reconstruction of historical expenditure estimates and introduced methodological changes in the measurement of visitor spend. While TRA considers the reconstructed time series suitable for analysing broad tourism trends, limitations associated with back-cast expenditure estimates, particularly in the smaller states, territories and regions, may result in greater volatility due to more limited survey sample sizes. As a result, figures prior to 2024-25 should be interpreted with a degree of caution.
For the first time, state and regional estimates are produced through a single integrated modelling framework using consistent input-output structures across all geographic levels. This provides a more coherent and robust basis for estimating tourism consumption, gross value added, gross regional product and tourism employment across Australia. The new model also expands the range of information available, including additional insights into tourism employment by sex and the distribution of male and female tourism workers across tourism-related industries.
TRA used DoTS and International Visitor Survey (IVS) data, together with the ABS Tourism Satellite Account, Labour Accounts, Census of Population and Housing, and State Accounts data, to produce these estimates. As DoTS commenced in January 2025, historical estimates have been reconstructed to support a consistent time series. Given increased uncertainty associated with longer-term backcasting at sub-national levels, this publication presents results from 2018–19 to 2024–25, allowing comparison with pre-pandemic conditions while maintaining data quality.
Please see below for further detail regarding changes in this issue.
1. Transition from TRA’s National Visitor Survey (NVS) to Domestic Tourism Statistics (DoTS)
In January 2025, TRA began producing Australia’s official domestic tourism statistics using a new approach: the Domestic Tourism Statistics (DoTS) collection. This marked the end of the long–running National Visitor Survey (NVS), which had been in place since 1998. DoTS is a revolutionary, world–leading approach to measuring official tourism statistics. It brings together face–to–face and online survey responses with large–scale mobility data.
Incorporating the DoTS data and DoTS back cast data has generated revisions to a range of TSA data series. While the core survey questions remain largely the same, the data collection method and modelling have changed. For this reason, the new DoTS data should not be compared with the historic NVS data. For further details on the new method of collection please see Changes to the Australian resident tourism statistics collection in 2025.
2. Changes to ABS Tourism Employment Ratios
This release reflects recent ABS improvements to the Tourism Satellite Account, including revisions to the derivation of tourism output, tourism taxes, tourism margins, tourism imports and tourism employment ratios. These changes improve the representation of tourism activity and tourism-related employment within the Australian economy.
Enhancements have been made to employment ratios by the ABS for the education and sports and recreation industries to better reflect their relevance to the visitor economy. These improvements ensure the ratios more accurately represent tourism–related employment. For further information on these revisions please see 2024–25 history of changes.
3. New State and Regional Tourism Satellite Account Model
Tourism Research Australia (TRA) develops annual State Tourism Satellite Accounts (STSA) and Regional Tourism Satellite Accounts (RTSA), highlighting the important economic contribution of tourism to these economies across a range of metrics, including consumption, output, gross value added (GVA), Gross State/ Regional Product (GSP/ GRP) and employment. The STSA and RTSA were previously developed in separate models, with both aligning with the National TSA developed by the ABS each year. TRA identified the revision of the National TSA by the ABS as an opportunity to review and revise if necessary the STSA and RTSA approach, including the aggregation and recalibration of the STSA and RTSA models into one comprehensive sub–national Tourism Satellite Account (TSA) model for consistency, ease of operation and update. The new model achieves the following outcomes:
a. Aggregation and Recalibration of Models: The STSA and RTSA models aggregated into a unified sub–national TSA model. This new model combines data from multiple sources and geographical levels, ensuring production of reliable and consistent estimates of tourism consumption and its economic impacts at state and regional levels.
b. Consistency with National Standards: The new sub–national TSA model continues TRA’s adherence to the Tourism Satellite Account: Recommended Methodological Framework 2008 (TSA: RMF 2008). This alignment ensures the model adheres to best practice standards and is consistent with broader economic frameworks, including the National TSA. This consistency is vital for ensuring quality and comparability of tourism statistics across various regions.
c. Improved consistency between state and regional estimates: By deriving state and regional results from a single modelling framework and common input-output structures, the new model improves internal consistency across all geographic levels. This ensures that state and regional tourism estimates are directly aligned and can be aggregated and compared with greater confidence.
d. Incorporating updated modelling data: The new model can be updated annually, enabling new data to be incorporated as it becomes available, such as updated regional spend data, National/ State Accounts data, labour data, Input–Output tables and Census data. This ensures that sub-national tourism satellite account figures remain concurrent with changes in economic and social environments at national and international levels.
e. Minimum manual model interference, reducing possibilities of error: The new model ensures modules run in a chronological manner with the ability to generate results, ensuring minimum manual inputs apart from inputting source data. This process limits the potential for human error and reduces the need for parallel processing of different modules, reducing time in producing the final output.
f. Expanded tourism employment insights and demographic data: The new model provides a broader range of tourism employment statistics than previously available, including estimates by sex and the distribution of male and female tourism workers across tourism-related industries. These additional data enhance understanding of the composition of the tourism workforce and support more targeted workforce planning and policy development.
4. Updated measurement of indirect estimates
Previous models could not accurately measure the impact of cross border trade flows in estimating the indirect contribution of tourism to the economies. This model allocates indirect contribution of tourism output, tourism GVA, GSP and Filled jobs to the areas where the impact occurs and not the jurisdiction where visitor consumption happens. This is technically more accurate as it does not include values that are occurring in the rest of Australia. For example, using jobs in Tasmania as an example:
- A direct job would be hotel cleaning staff at a hotel in Hobart
- An indirect job (TAS) would be the laundromat staff in Hobart that clean the hotel sheets
- An indirect job (Rest of Australia) would be the retail company based in NSW that sold the hotel sheets.
Continuing the example, such indirect (Rest of Australia) jobs are jobs supported elsewhere in Australia because of tourism demand in Tasmania. The information around what Tasmania provides to other states in Australia is interesting but does not provide a benefit/ impact to Tasmania. If you add all the states’ indirect estimates including Rest of Australia, the final result is more than the national total, as the jobs one state supports in the rest of Australia are counted in the jobs for those other states.
The old model produced very similar direct-to-indirect ratios across states and territories. The new model better reflects real differences between jurisdictions:
| State | Old model | New model |
|---|---|---|
| Direct jobs | Total jobs* | |
| New South Wales | 117.8% | 119.6% |
| Victoria | 117.4% | 128.0% |
| Queensland | 117.3% | 99.2% |
| South Australia | 114.9% | 113.9% |
| Western Australia | 115.1% | 110.9% |
| Tasmania | 115.1% | 82.9% |
| Northern Territory | 105.1% | 58.5% |
| Australian Capital Territory | 112.5% | 85.9% |
| Total | 116.7% | 112.9% |
*Denotes direct and indirect tourism jobs
As the new model removes indirect (rest of Australia) numbers from state and territory figures, there is a substantial drops in indirect figures for some states and territories. Some states and territories may want to include indirect (rest of Australia) to account for the impact of the state/ territory tourism sector, even if it is not happening within the state/ territory.
This update is reflected in STSA results Table 10: Indirect contribution of tourism to state and Territories, 2024–25. Two additional columns have been added (to each state and territory results) to the indirect tables to show indirect contribution to the state, from the state (Rest of Australia) and to and from the state Indirect total. The published Total tables (Table 11: Total contribution of tourism to the state and territory, 2024–25), are the addition of Direct and Indirect and do not include Rest of Australia figures. If Rest of Australia figures were included, the addition would sum to greater than the total as these Rest of Australia figures are already accounted for in other states (see above).