
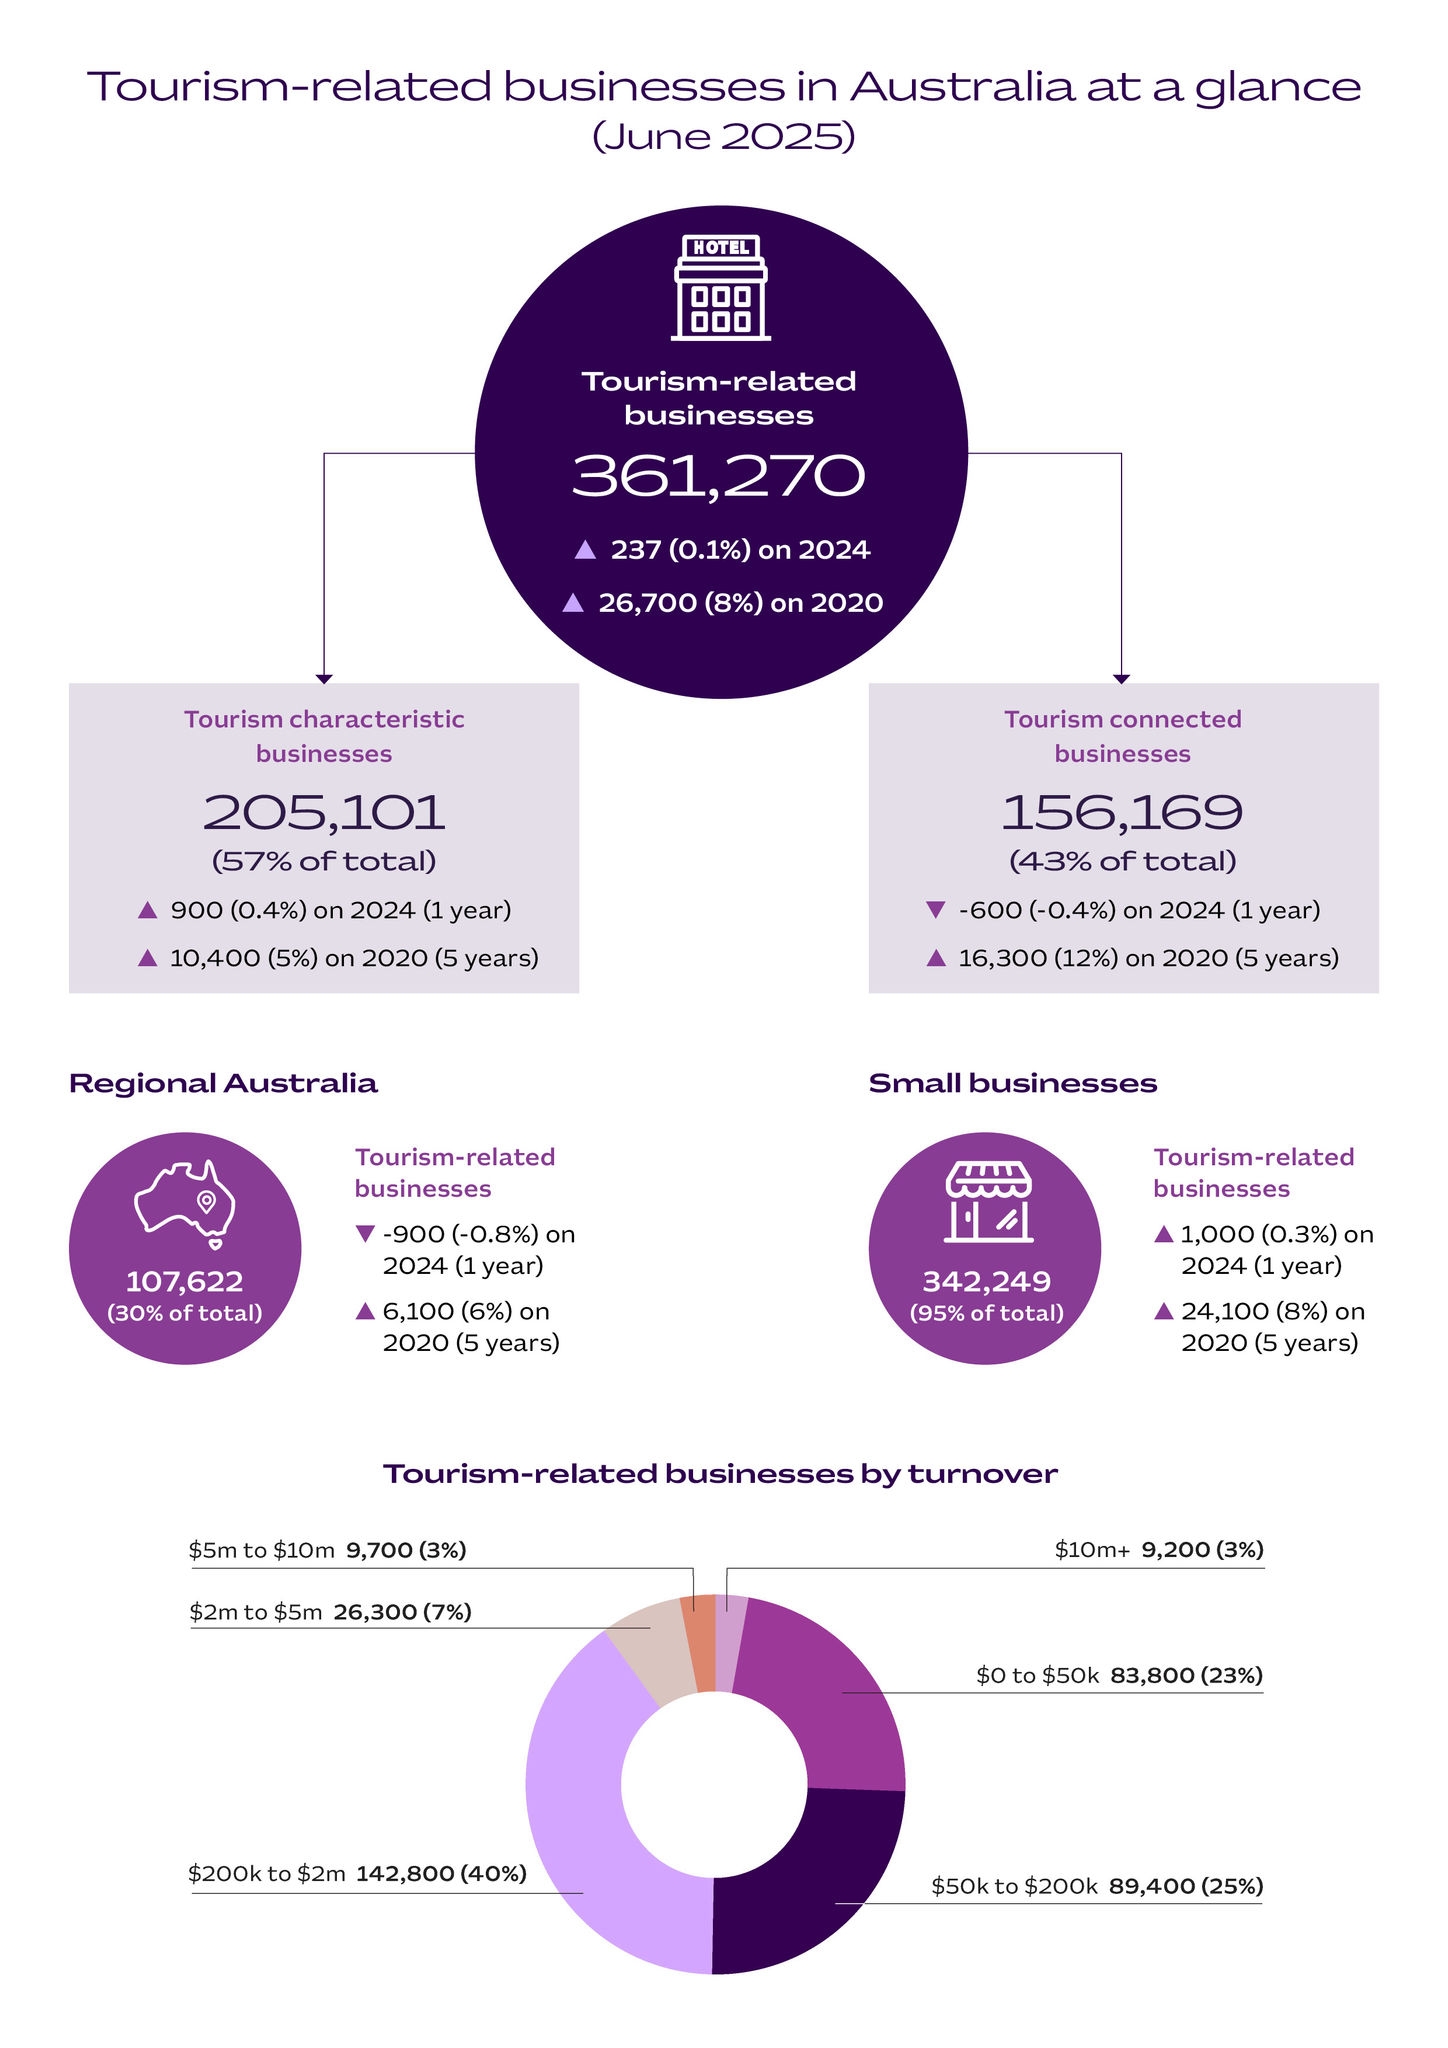
The infographic above shows tourism business statistics including total number of businesses. The division is between tourism-characteristic, tourism-connected industries, proportion of businesses in regional Australia, number of small businesses, and tourism businesses by turnover. Statistics as follows:
- There were a total of 361,270 tourism-related businesses in Australia in June 2025. This is an increase of 237 business (0.1%) on last year (June 2024) and an 8% increase (36,700 business) on June 2020.
- 57% of tourism-related businesses are from tourism-characteristic industries, while the other 43% are from tourism-connected industries.
- The number of tourism-characteristic businesses has increased by 0.4% since June 2024 and by 5% since 2020.
- The number of tourism-connected businesses has decreased by 0.4% since June 2024 but increased by 12% since 2020.
- Regional Australia stats: 30% of tourism-related businesses are located in regional Australia. This has remained relatively consistent since 2020.
- Small businesses stats: 95% of tourism-related businesses are classified as small (with less than 20 employees including non-employing businesses).
The most common turnover range of tourism-related businesses in 2024-25 (encompassing 40% of businesses) was $200,000 to $2 million. Next were $50,000 to $200,000 (with 25%) and $0 to $50,000 (with 23%). Businesses with turnover greater than $2 million accounted for only 13% (7% for $2 million to $5 million; 3% for $5 million to $10 million and 3% for over $10 million).